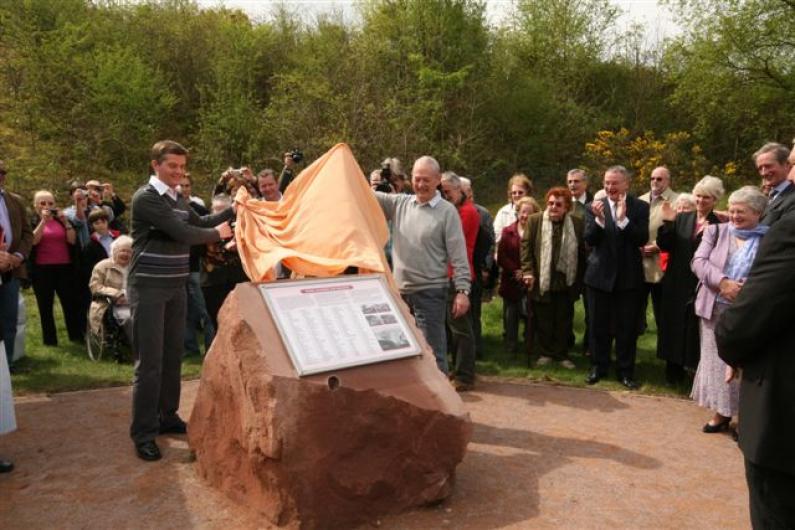
In 2007, the Forest of Dean Local History Society was awarded a grant of £107,200 by DEFRA’s Aggregates Levy Sustainability Fund (administered by Natural England) to produce a spectacular piece of sculpture, known as ‘The Geomap’.
The Geomap is an amalgam of two maps. Firstly it is a geology map of the Forest of Dean. Instead of bright colours on a piece of paper, the rock strata are represented by rocks taken from both operational and disused quarries in the Dean. It is a 900 square foot rock map in surface view which is flat and polished, but not shiny, so that the public can walk on it. We believe it is the only map of its kind in the world.
Secondly, it is an industrial history map showing the location of 102 collieries, 35 iron mines and 49 stone quarries, as well as the main railway lines and three long-lived tramroads that were so important for the expansion of these industries in the nineteenth century. The mines and quarries are located using numbered discs on the map; basalt for the collieries, steel for the iron mines and marble for the quarries.
The great industries of quarrying and mining in the Forest of Dean date back to pre-Roman times. Most of the coal and iron mines on the map are now disused, but several quarries are still in use, providing both building stone and aggregate. The coal seams are located in the Pennant and Trenchard Groups and the iron mines were virtually all located within half a mile of the Crease Limestone, part of the Carboniferous Limestone Series. Quarries are located in limestone areas for aggregate extraction and formerly for agricultural lime, and in sandstone areas for building stone.
The Geomap demonstrates the link between the underlying geology and the quarrying and mining industries in the Forest of Dean, and celebrates these great industries both of the past and the present in this unique and beautiful landscape.
 Forest of Dean Local History Society